The impact report structure, slide by slide
Borrowed from the Wright brothers' investor update structure. Each beat is one slide, three at most.
- 01 CoverWho it is from, who it is to, and the month in one line.
- 02 TL;DRThe whole update in the length of a telegram: outcome, headline number, ask, next date.
- 03 AsksTwo or three specific requests, each with an owner and a due date. Put them near the top.
- 04 Key metricsOne hero number with its time frame, then the same 4 to 6 KPIs as every month, each against plan or last period.
- 05 Proof chartThe trend behind the hero number, so investors see the slope, not just the point.
- 06 HighlightsTwo or three wins, each with evidence, including the work that made the result possible.
- 07 LowlightsThe misses, stated plainly, with a status for each. Never skip this section.
- 08 Burn and runwayWhat you spent, where the money came from, and how long it lasts. Benchmark it.
- 09 CompetitionYour position against the best-funded rival, row by row, with dates.
- 10 What's nextNext period's priorities with a target for each; they open next month's update.
- 11 ThanksName the people who helped, then restate the one action you need.
- Use it when
- Reporting results to funders, donors, a board or partners, and asking for the next round.
- Typical length
- 8 to 12 slides.
- Format
- Sent to be read, then presented when funding is decided.
See it in a real deck
The Wright brothers, The December 1903 investor update, 1903. Success. Four flights Thursday morning. Inform press. Every slide opens our playable rebuild right where it is.
-
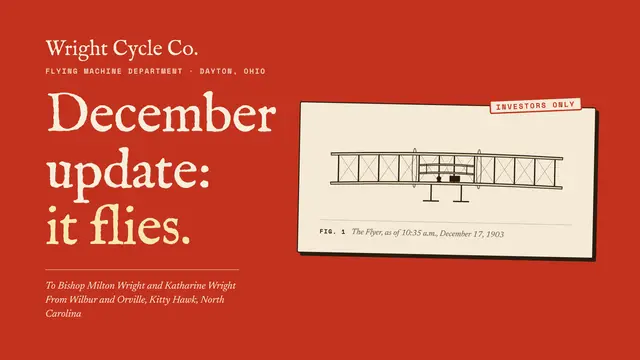 01December update: it flies.
-
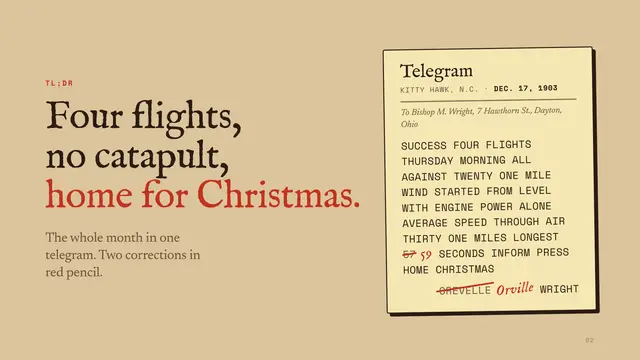 02Four flights, no catapult, home for Christmas.
-
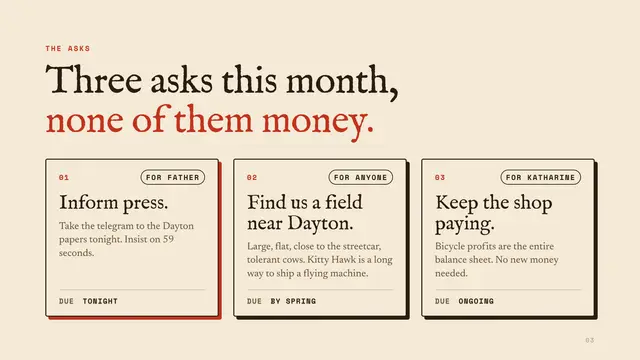 03Three asks this month, none of them money.
-
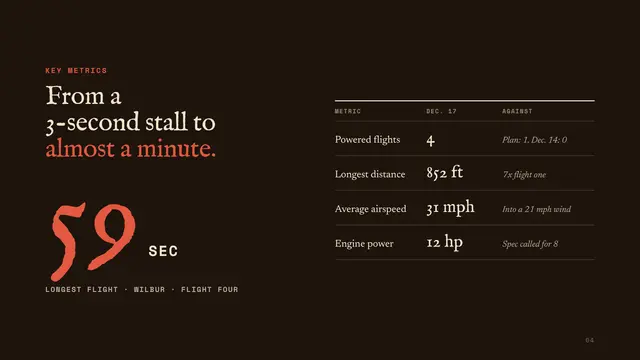 04From a 3-second stall to almost a minute.
-
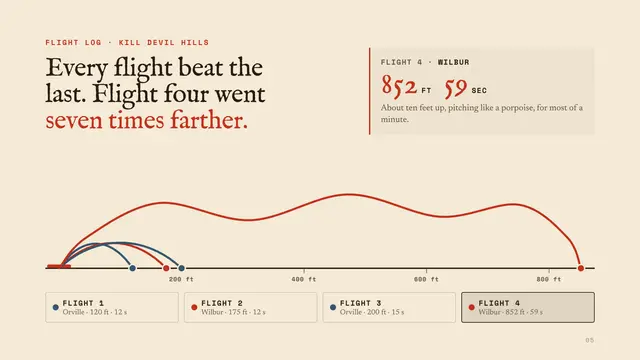 05Every flight beat the last. Flight four went seven times farther.
-
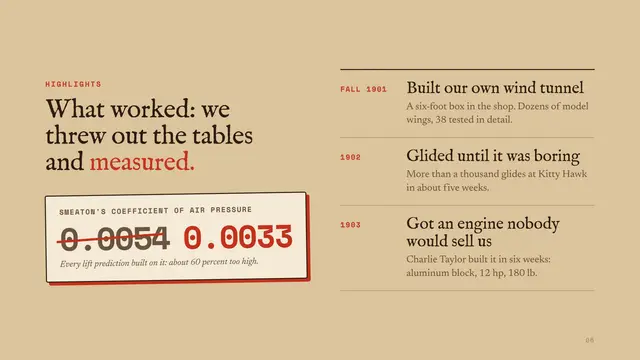 06What worked: we threw out the tables and measured.
-
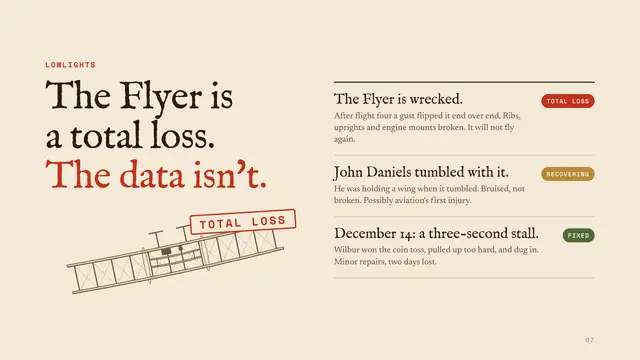 07The Flyer is a total loss. The data isn't.
-
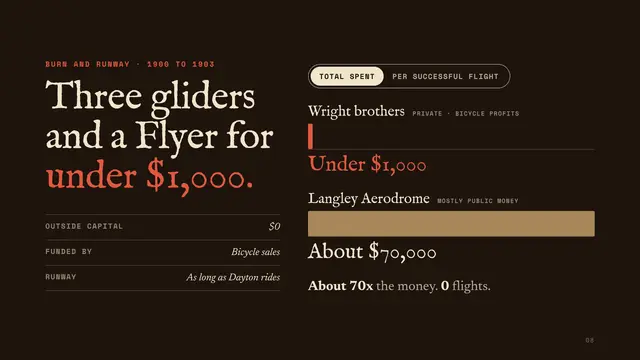 08Three gliders and a Flyer for under $1,000.
-
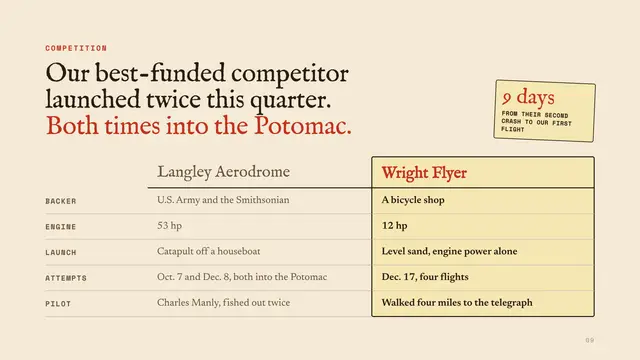 09Our best-funded competitor launched twice this quarter. Both times into the Potomac.
-
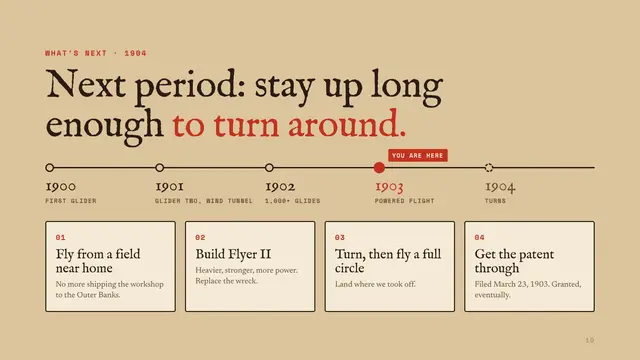 10Next period: stay up long enough to turn around.
-
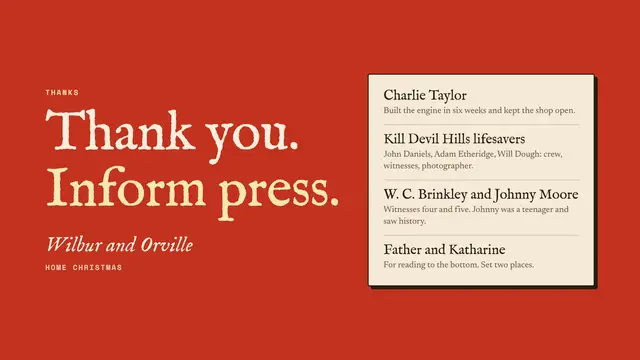 11Thank you. Inform press.
More impact report examples
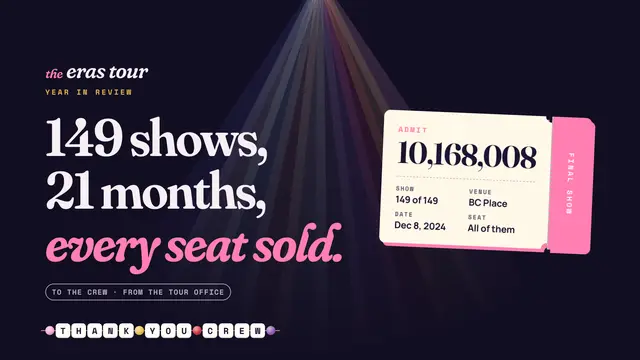
What good impact report decks do
- Lead with the outcome in one number people will remember.
- Show how you measured it, so the number can be trusted.
- Pair each number with one real story that makes it human.
- Say what did not work and what you changed.
- Tie the next ask to the next result it will buy.
Where impact report decks usually fail
- Activity counts instead of outcomes
- A wall of metrics
- Only good news
- An ask with no result attached
Common questions about the impact report
What goes in an impact report?
The problem you set out to change, the outcomes you achieved with numbers, how you measured them, the stories that make the numbers real, what you learned, and what the next round of support will make possible.
How do you show impact with data?
Pick the one chart that makes the case at a glance, the way the Wright brothers' telegram led with one result (four flights), and label it in plain words. A wall of metrics hides the result you want remembered.
Who reads impact reports?
Funders, donors, boards and partners deciding whether to keep supporting the work. Write for someone who will skim it once and has to explain it to someone else.
Make yours with this structure
Type your site and we'll write the prompt for your deck, in your brand, built on the Wright brothers' investor update structure.
Building it with AI? Compare the ways to make it with Claude, or add Pitch Unfairly to ChatGPT or Codex.
More strategy guides
-
 Quarterly business review (QBR) template Their outcomes first. Your activity never. Board and investor updates. Example: Jurassic Park, 1993 →
-
 Discovery call deck Ask first. Pitch later. Book the next meeting. Sales. Example: The Wolf of Wall Street, 2013 →
-
 Proposal template One decision, made easy to say yes to. Proposals and business cases. Example: Romeo and Juliet, 1597 →